
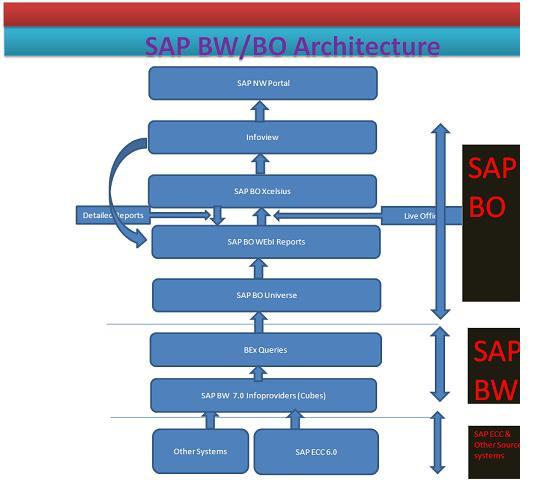
Data in the Infocubes in BI system and the queries can be accessible by WebI report through Universe semantic layer or can be directly used by Infocubes with EHP1 or SP6 on SAP BI 7.1 version and BO XI 3.1 version SP3 and Fix pack 3.4(4).
Xcelsius dashboards directly fetch the live data and shows latest information to users..
The best approach for creating effective and efficient dashboards using SAP BW and BO systems.
1. User Requirements:
Understanding of user requirements and feasibility analysis of the requirements is very important. Communicating users about limitations using dashboards and keeping expectations right.
2. Dataflow:
Data flows and screen flows created is very much useful and saves time and improves clarity. Proper Modeling of Universe, WebI reports and Xcelsius is required to optimize the performance of the dashboards to handle the data volume.
3. Visualization
Visualization of the dashboards is very important. Details of graphs, charts, data points, filters, radio boxes, links to external reports, quadrants everything should be visualized before starting actual development of the dashboard.
4. High level analysis only
Dashboards are meant for only high level, aggregated analysis and don’t try to display too much of data on dashboard.
5. Detailed Requirements on WebI reports/Crystal Reports:
Should provide link using Open documents to WebI reports or Crystal reports .
6. Data Availability from the source
Data availability from the underlying source systems is the foremost important thing. Make sure the data from underlying BW system or any other source system is accurate.
7. Query structure:
BW query structure should be created according to the dashboard requirement and not to include too many free characteristics and query design should be at the possible aggregated level.
• 8. Improvisation of the dashboards
Keep on improvising the dashboards based on the input inputs from the stake holders.
9. System Limitations :
System performance should always be taken into consideration. Always better to know the limitations.
10. Calculations at BW system:
It is always advisable to keep calculations at BW level to improve the performance of the dashboard.
11. Avoid using unnecessary formulae in Dashboards:
Keep minimum formulae in dashboards to avoid unncessary performance issues and dashboard long runtimes.
12. Scheduling reports
Report scheduling is a two step process for dashboards in Xcelsius dashboard.
a. WebI reports can be scheduled from Infoview to get regular data refresh from BW queries.
b. Live office refresh loads at regular intervals refresh data mapped in Xcelsius.
13. Roles and security:
Define and Import roles from underlying SAP BW system and create appropriate user roles and security.
14. Testing:
Complete proper functional and technical testing.
No comments:
Post a Comment